
In my article Using MadCap Central for SME reviews, I described how MadCap Central can be used for cloud-based review of content created in Flare. In addition, Central has always provided a range of version control, project management, and publishing facilities. I'm writing about Central again now because last year MadCap added a new killer-feature, Analytics, that makes the case for a subscription to Central even more compelling.
One of the Holy Grails of technical communication is to find out how our users are accessing and reading the content that we create — this is where Analytics comes in. You may already be analysing server logs or using services such as Google Analytics. However, these methods are not necessarily tailored to our needs as Technical Communicators, and it is sometimes challenging to find out about unsuccessful attempts to access our information, such as searches that yielded no results. Standard forms of Analytics may also not tell us what we need to know about how users are accessing our content directly from a software application via a context-sensitive link.
The new Analytics feature in MadCap Central gives us all the standard information (such as pages viewed) that we would expect from other Analytics tools, in a graphical form that is easy to sort, filter, and analyse. In addition, it gives us a range of more specialist data that helps Technical Communicators make informed decisions about content and navigation design.
What are the requirements for Analytics in Central?
To use Central's Analytics, you simply need to have a valid Central license with at least one Author seat. The only other requirement is that, for usage data to be successfully transmitted to Central, your users must have a live Internet connection when they are reading your HTML5-based output.
The output files do not have to be hosted on Central, and could even be made available to users on their local computer or via a LAN. The source Flare project does not need to be bound to Central (for source control). As a result of this very undemanding set of requirements, Analytics in Central is potentially available to all Flare authors, except that small minority whose users are in environments without Internet access.
How do I set up Analytics for an output?
To obtain Analytics data for an HTML5-based output from Flare, you need to create a unique Key. This requires you to have an Author user name on Central, with permission to ‘Manage Output Analytics Keys’. From within Flare (2019 r2 and above), you can create a Key and assign it to the target for the required output by doing the following:
- Open the Target in the Target Editor.
- Select the Analytics tab.
- From the dropdown list of Providers, select Central.
- If prompted, log in to Central using your user name and password.
- In the Key section, click the Create button to display the dialog shown
below.
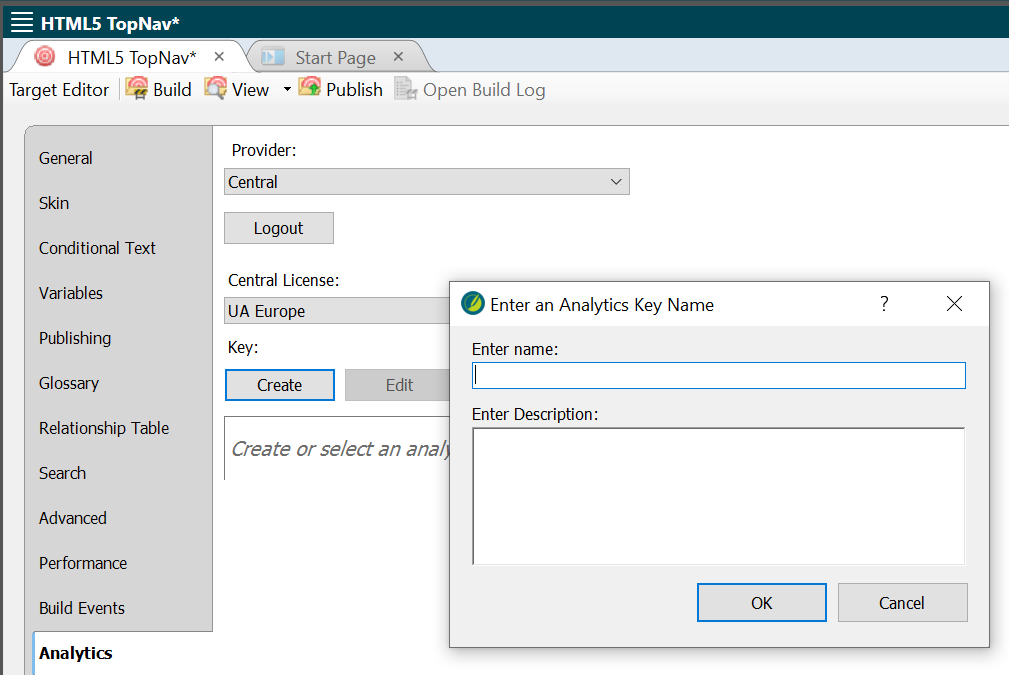
- Enter a unique name (spaces allowed) and optional description for the Key, and click OK.
- Save and build the Target.
How do I view the Analytics data?
To view the Analytics for an HTML5- based output, you have to be in MadCap Central. After logging in to the MadCap Central portal within your browser, do the following:
- On the left side of the workspace,
select the Analytics page (shown below).
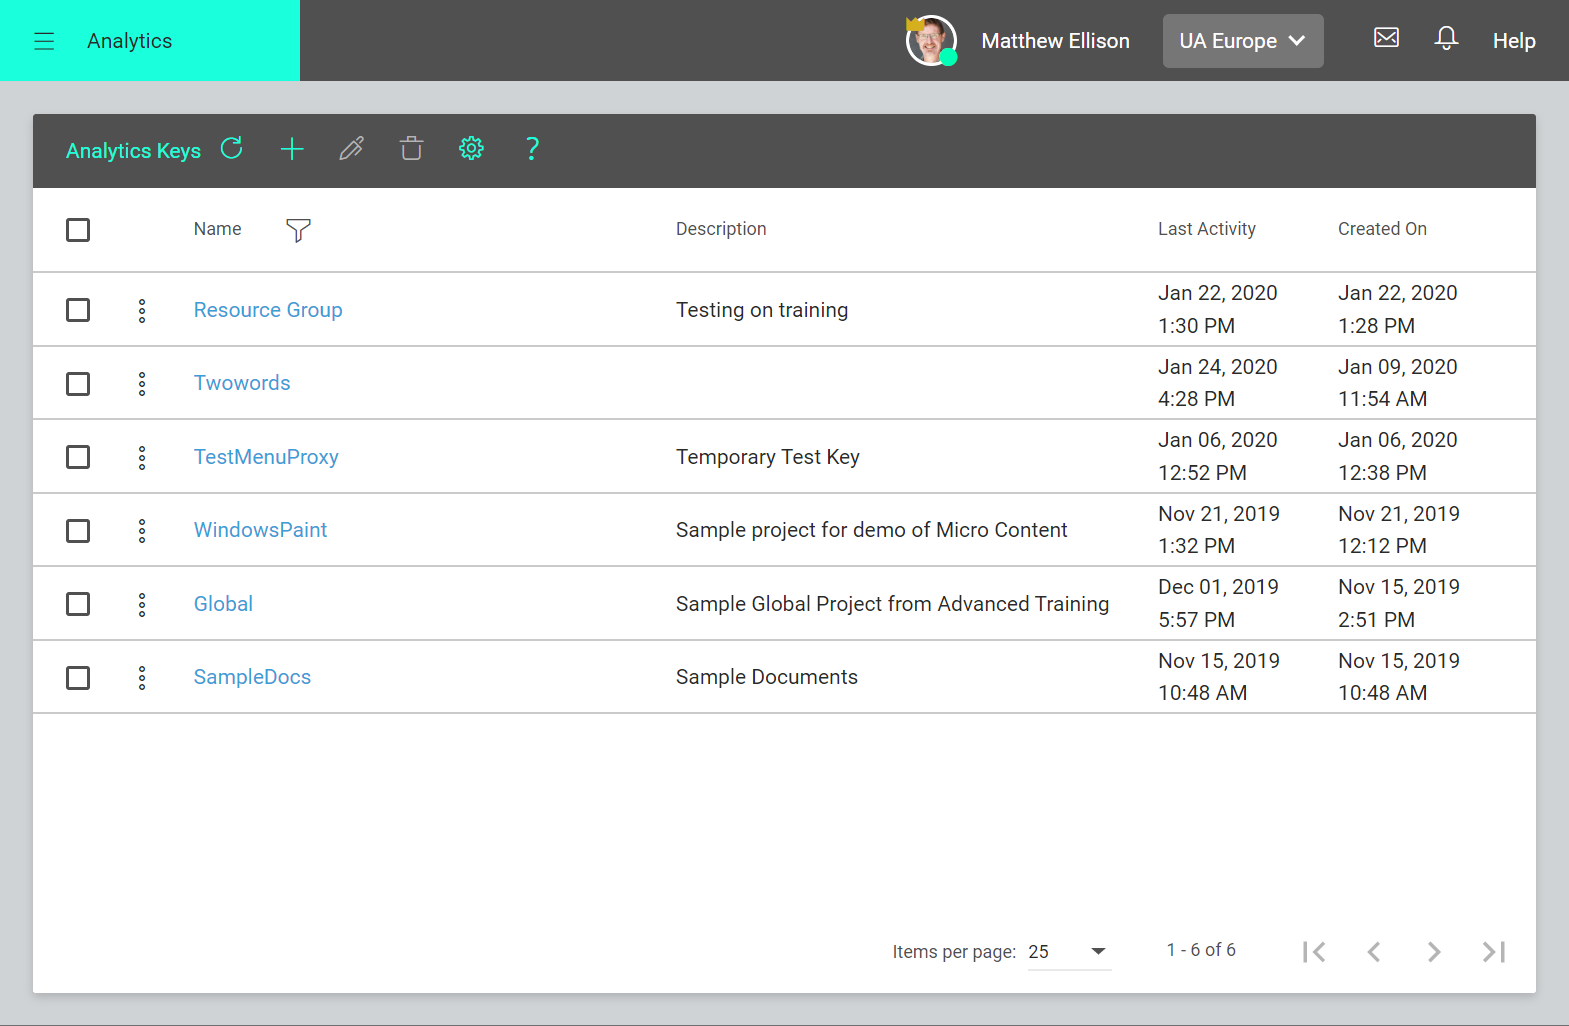
- Click the name of the Key that you assigned to the Target in Flare.
- Choose the type of Analytics data that you want to view.
What types of Analytics data are available?
You can choose to see the following information:
- A list of topics viewed, with the view count for each topic. This information is also presented as a bar chart, and you can filter the topics shown by path, topic title, and view count. For example, you could choose to view only topics that have been viewed fewer than 20 times.
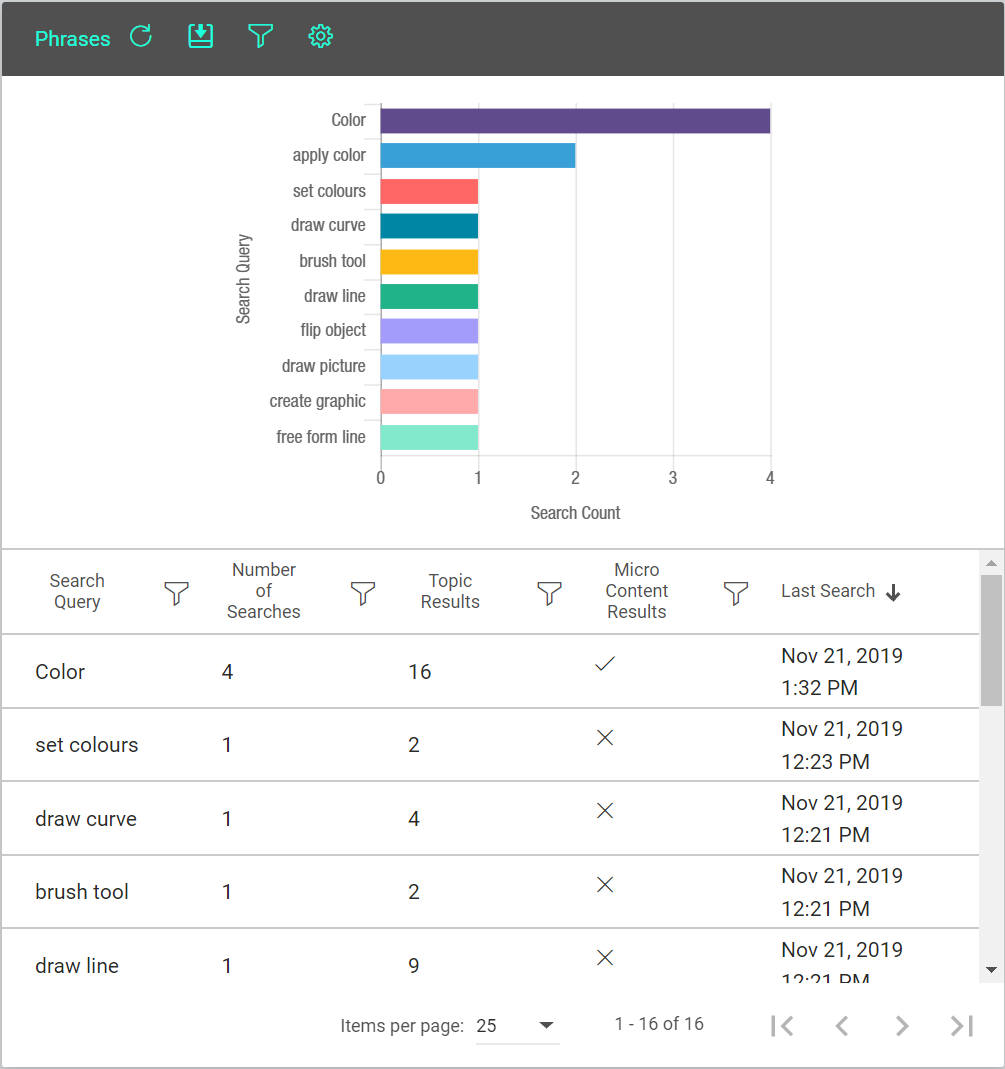
- Phrases that users have searched
for, with the number of topic results
and whether micro content has been
displayed (see below). Perhaps even
more usefully, you can view a list of
all phrases that users have searched
for that have yielded no results. All
this information is shown in bar-chart
form, and can be sorted and filtered.
- Context-sensitive calls, including the Context Sensitive Help ID used by the call, and the number of times each ID has been called.
- Demographics information including browser and operating system statistics. This information is presented graphically in piechart form.
How can I use this information?
Here are some ways in which I suggest you could use the Analytics data to fine-tune and enhance your HTML5- based help:
- Add synonyms and index keywords for search phrases with no results.
- Add micro content for popular search phrases.
- Evaluate topics that are never or infrequently viewed. Are they really needed? Or should they have a higher profile and be easier to find?
- Prioritise popular topics for maintenance and update, and consider adding more links to other important (but less frequently-viewed) topics.
Conclusion
MadCap Central provides a comprehensive and convenient set of Analytics data that is tailored to the needs of technical communicators. This information can be used to improve significantly the findability and effectiveness of HTML5-based content.
Further reading
Flare’s Help on Central Analytics
Background article from Google on Google Analytics
![]()
Training and Consulting in MadCap Flare
UA Europe provides specialist consulting and training (either face-to-face or via the Web) in MadCap Flare.